What buy-and-hold is
Buy-and-hold is the decision not to time. You pick a name, you buy it, and you do not walk a stop or wait for a rebound signal every day. Timing looks smarter. The cost is the gap you leave empty. On Korean large caps that compound over years, that gap cuts the compounding.
The question I actually ran was narrower. If stops and re-entries get more precise, can they beat sitting? If they cannot, what value is left?
What I ran
Two universes. Korean listed ETFs close to a real book — KODEX 200 (1x index), a 2x leverage ETF, a covered-call ETF, and a US-listed 3x Korea ETF. And the 25 largest Korean names: Samsung Electronics, SK hynix, Hyundai Motor, Naver, Kakao and the rest.
Prices are daily closes. Korean listings from Toss Securities official adjusted candles, the US-listed 3x from Yahoo. The window is May 2010 through August 2026, or from listing. Results start after 252 sessions so moving averages are warm. Costs: 0–0.05% on buys, 0.03% on ETF sells, 0.18% stamp tax on stock sells.
The rules were four families. A full cycle: 20-day high in, 20% off the peak or RSI 80 out. A slower cycle: 50-day high in, 15% off the peak out. A 200-day moving-average filter. And the coin-trading engine: z-scores of MACD, RSI, AO, disparity, and RTI, summed, then a break from the recent min or max of that sum. Scale-in, scale-out, oversold recovery, and a market-regime filter sat on the same data.
On the 1x index you pay return for drawdown
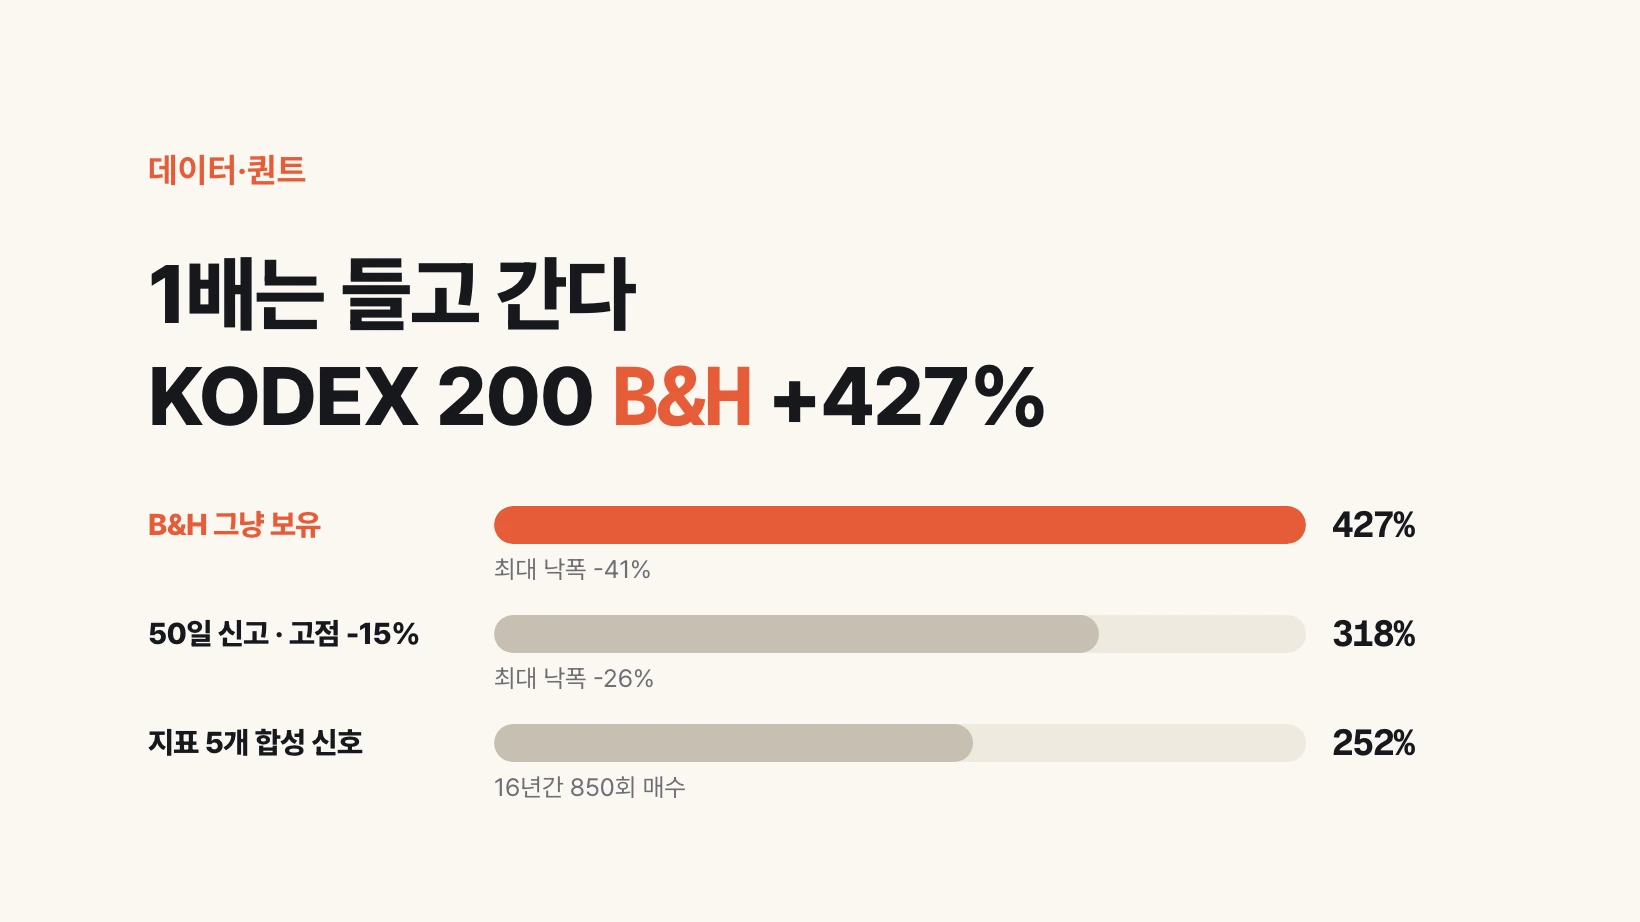
KODEX 200 is the clean read. Hold it and you get +427% with a -41% max drawdown and a Sharpe of 0.60. Buy the 50-day closing high and sell 15% off the subsequent peak: +318%, -26%, Sharpe 0.65. About 110 points of return leave; 15 points of drawdown leave with them. Sharpe is similar or a little better. That is the insurance in this piece. It does not extract extra alpha. It sells compounding to cut the middle crash.
Staying long only above the 200-day line barely cut the drawdown. On KODEX 200 it stayed -41%, the same as hold. The index had already fallen a long way before it lost the average, or you got back on late.
| Rule | Return | MDD | Sharpe |
|---|---|---|---|
| Buy-and-hold | +427% | -41% | 0.60 |
| 50-day high · -15% off peak | +318% | -26% | 0.65 |
| 200-day MA | drawdown almost unchanged | -41% | below hold |
Across 25 large caps the median is still hold
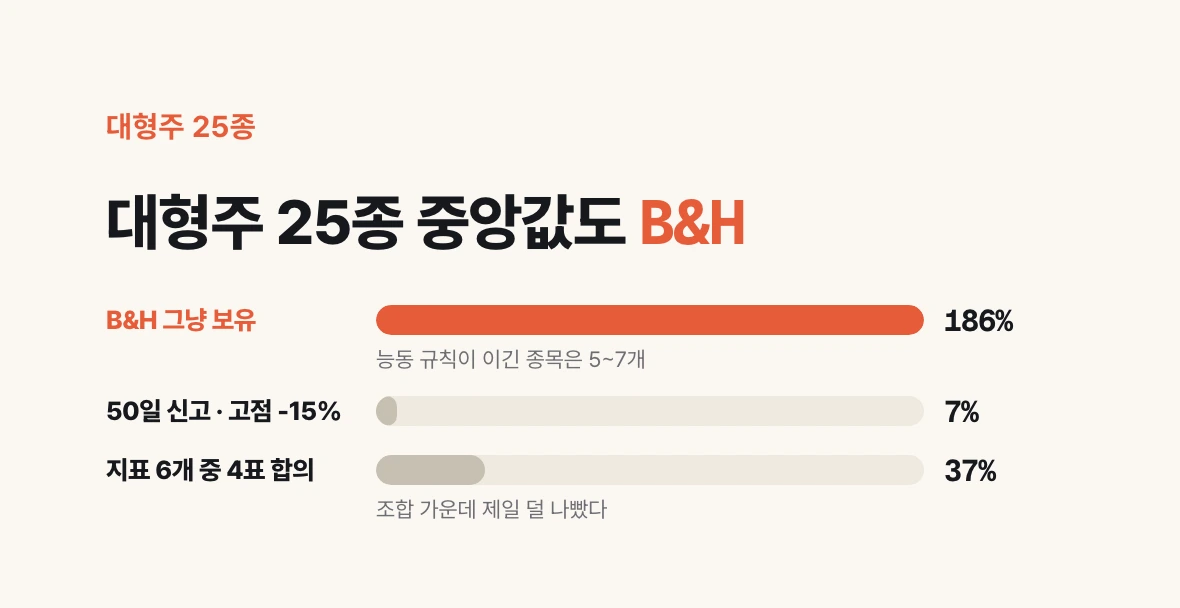
Widen the book to 25 names and the picture holds. Whatever active rule I used, only about five to seven names beat buy-and-hold on full-window return. Median return: hold +186%, 50-day/-15% +7%, require four of six signals +37%.
Stops are most expensive on names that compounded for years — Samsung Electronics, SK hynix. Hynix hold prints a multi-thousand-percent window. A 20-day or 50-day cycle cuts the middle of that compounding. On names that broke in the middle — Kakao, KEPCO, Doosan Enerbility — a 200-day line or a golden cross sometimes beat hold. It did not flip the median.
Slice the window and exceptions appear. Samsung Electronics has a post-2018 window where a 20-day high and a 20% trail beat hold. That is Samsung’s window, not a large-cap law. Pick the rule on the full-window median and you are back at hold.
| Rule | Large-cap median return | Names that beat hold |
|---|---|---|
| Buy-and-hold | +186% | — |
| 4 of 6 votes | +37% | 6/25 |
| Toss 4-indicator, sell on 3 | +7% | 4/25 |
| 50-day high · -15% off peak | +7% | 4–5/25 |
Why stops lose on 1x
The large gain on a 1x large cap accrues over years, not days. A stop treats a mid-trend -15% as danger. On a 3x ETF that is roughly a 5% move in the underlying. On 1x it is an ordinary pullback. Exit on every one of those and you re-enter after a new high is already confirmed. The cut piece does not come back.
A cleaner rebound signal did not fill that hole. Measuring a false start as getting stopped again within 20 sessions, an RSI drop below 30 then a recovery through 50 was 100% on KODEX 200. The cost was fewer entries and a lower return than the 50-day rule. Cut fakes and you also miss the real open.
Scale-in and scale-out did not reorder 1x. Buying in thirds reduces the loss the day after a crash and also misses the front of the rally. Selling in thirds leaves a stub that blocks a full-size re-entry. On 3x that stub is how you miss the second leg.
Stacking indicators recounts the same trend
The coin engine does not take a majority vote. It turns MACD, RSI, AO, disparity, and RTI into z-scores, adds them, and buys when that sum has stretched more than a threshold above its recent low. On 5-minute and 2-hour bars the indicators fidget on different clocks. The z-score puts them on one scale.
Drop the same formula on Korean large-cap daily bars and it trades constantly. On KODEX 200 it bought more than 850 times in 16 years — about once every three sessions. After costs the return is +252%, short of hold +427% on the same window. MACD, RSI, and disparity move with the same trend. The sum adds almost no information. The threshold just gets twitchy and you get high-frequency mean reversion. On Samsung and hynix, after costs, it lost money.
Counting votes — two of six, three, four — did not flip the median either. Four votes was the least-bad combination and still printed +37% median on large caps against hold +186%. On this market and this clock, combining indicators is counting the same trend several times.
The exception is 3x
A US-listed 3x Korea ETF is the other story. Buy-and-hold in the same window is a -96% drawdown. A 30% drop in the index is most of the 3x capital. There a 20% trail off the peak and a 20-day closing-high re-entry is the strategy. After costs, the full window is roughly +545% versus hold +36%.
A 2x leverage ETF sits in between. Full-window return still often favours hold. The cycle does cut drawdown. An older conclusion that a 200-day line is the 2x filter did not reproduce here once start date and warmup were aligned.
The multiple sets the rule. Hold 1x. Cut 3x. Cut 2x only if you are buying drawdown, not return. One rule across three multiples gets at least one of them wrong.
| Asset | Default | What a stop does |
|---|---|---|
| 1x large cap · index ETF | Buy-and-hold | Insurance: pay return, buy drawdown |
| 2x leverage ETF | Hold often still leads on return | Drawdown relief |
| 3x Korea ETF | 20% off peak + 20-day high re-entry | Hold is a wipeout path |
What to do
Read the multiple before you pick a stop. 1x and 3x do not mean the same thing when you cut a 15% dip.
If you mean to hold Korean large caps or a 1x index ETF for years, the default is buy-and-hold. Do not watch a signal every day. If you cannot sit through a mid-run -40%, buy the insurance with eyes open. On KODEX 200 the price looks like this: buy a 50-day closing high, sell 15% off the peak, and wait for the next 50-day high only after you are flat. You are trading about 110 points of return for 15 points of drawdown.
If you run a 3x Korea ETF, reverse it. Sell the whole stub at 20% off the peak. Buy the 20-day closing high. RSI 80 as an overheat exit only earned its keep at this multiple. Do not copy that rule onto 1x.
Do not stack five indicators to 'see the rebound more clearly'. On daily large caps that sum recounts the same trend five times. The number to check is not the composite score. It is how much return the rule gives up versus hold, and how much drawdown it buys.