What launched, and who can use it now
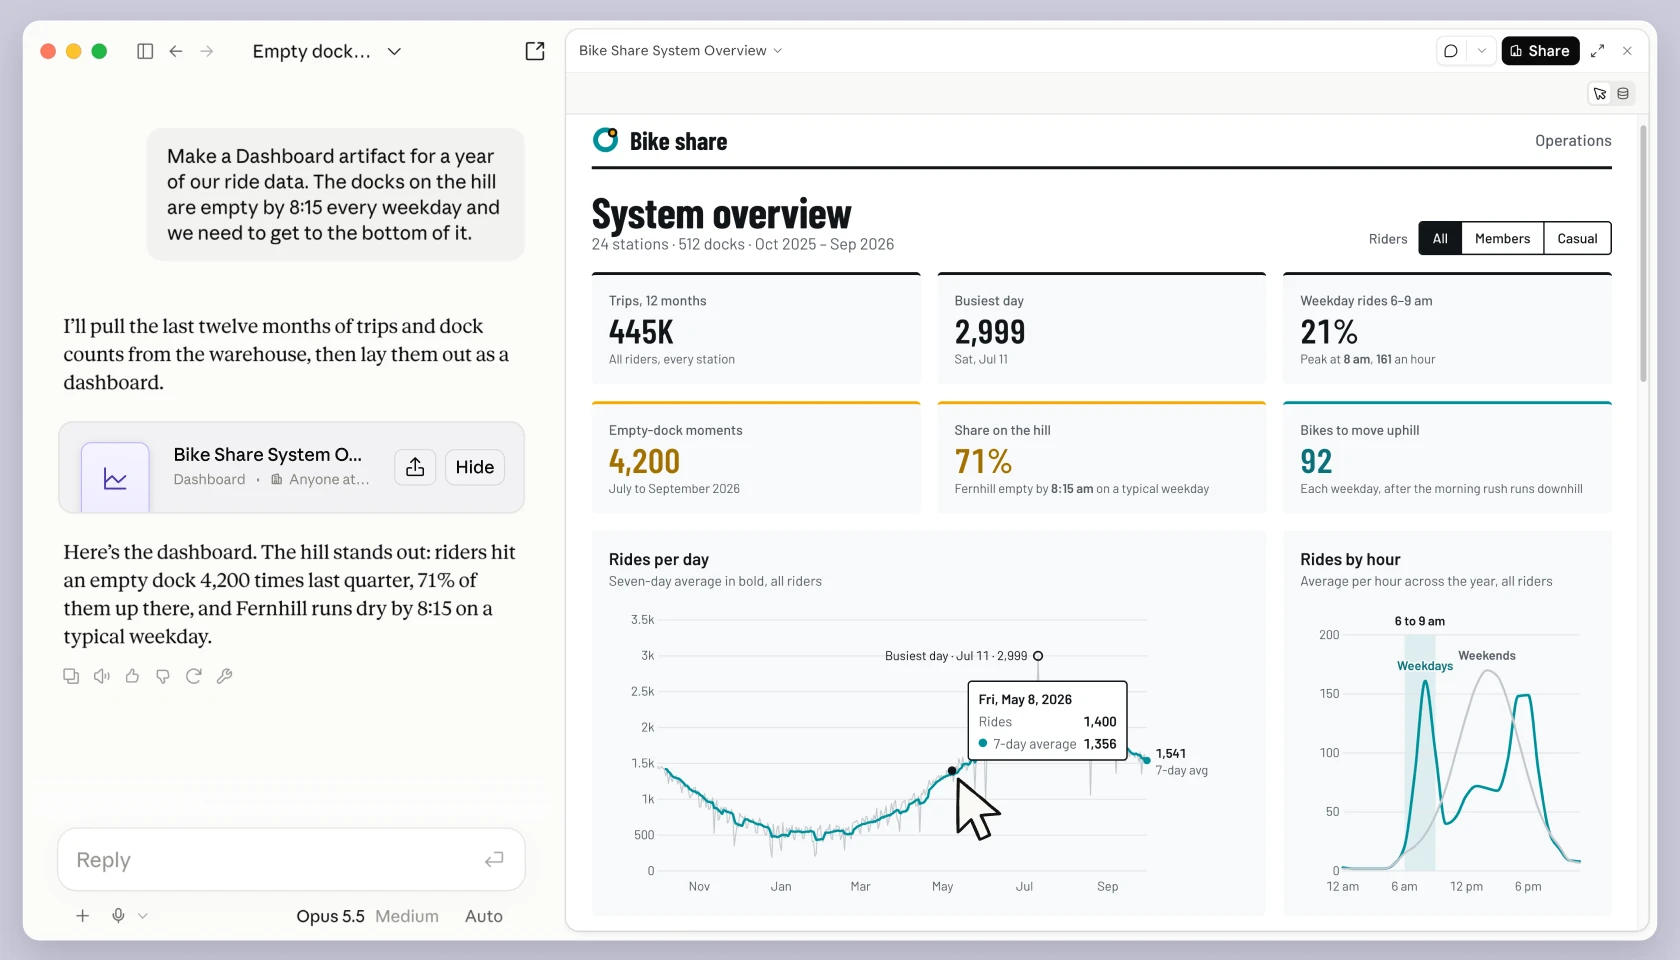
On October 8, 2026, Anthropic added two features to Claude. Claude Dashboards turns company data into dashboards. A dashboard is a status board that gathers many numbers and charts on one screen. Claude Motion turns an idea or a report into a moving explainer video. Both are artifacts: the result opens in a pane next to the Claude conversation. An artifact is a document, slide, or screen that Claude produces separately from the chat itself.
Both are in beta, meaning they are still being tested and refined before a full release. The plans that can use them differ. Dashboards is open to paid plans, while Motion is open only to Team and Enterprise plans. The individual Free plan cannot use either feature yet.
On Enterprise plans, both features are off by default. An admin must turn them on under Organization settings > Artifacts before members can use them. If you use Claude through a company account and do not see them in the menu, check this setting first.
This article is based on Anthropic's announcement and its official example screens. It is not the result of connecting and using the features myself, and the announcement does not say how well they handle requests in Korean.
Dashboards — ask your company data questions without a request ticket or SQL
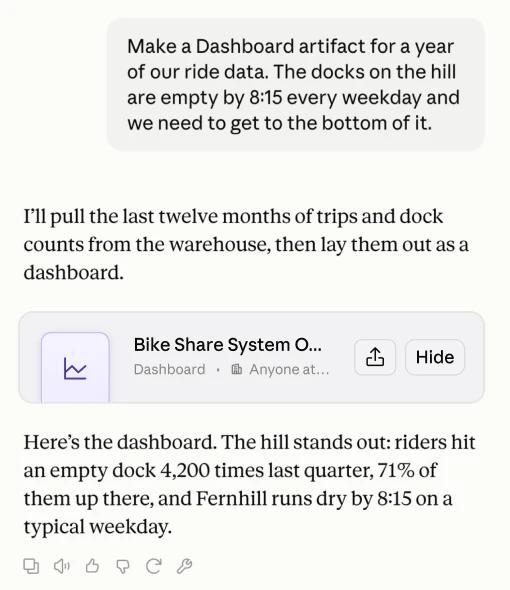
To check a single company number, you usually had to file a request with a data team or write SQL yourself. SQL is the query language used to pull the numbers you want out of a data warehouse. So people either wait or skip the check. This is the problem Anthropic pointed to when it released this feature.
Dashboards works by connecting to your company's data platform. A data platform is a large warehouse that keeps the company's transaction, sign-up, and usage records in one place, and the announcement names Amazon Redshift, BigQuery, ClickHouse, Databricks, and Snowflake as examples. Once connected, you ask questions in plain language, Claude pulls the answers from the data and builds a dashboard, and the dashboard refreshes as the data changes.
It also works together with other connectors you have already set up. A connector is a link that ties Claude to another business service. The example in the announcement is a Salesforce opportunity dashboard. Salesforce is a CRM, a program that manages records of customers and sales progress.
Anthropic says this feature suits quick-look questions. The example question it gives is "How are this week's sign-ups compared with last month?" It is not presented as a replacement for deep analysis.
Click a number to see the query — two things to check before sharing
Click a number on the dashboard and you can see the query that produced it. A query is the actual request sent to the data warehouse. If the query is hard to read, ask Claude to explain it. Each chart also shows when its data was last refreshed.
If the number will feed a decision, check two things before sharing. First, click one important number and confirm which period and conditions Claude used to count it. Second, confirm that the refresh time reflects the data as of the meeting. Anthropic also states in the announcement that Claude builds the first draft and people decide what to share.
If you need deeper analysis, send the dashboard to the BI tool your company already uses. A BI tool is a specialized program for data analysis and recurring reports. The places you can send it today are Amplitude, Grafana, Hex, Mixpanel, Omni, Perplexity, PostHog, and Sigma, with Looker, monday.com, and Tableau coming soon. Dashboards is presented as a feature that works alongside these tools, not one that replaces them.
Motion — turn a quarterly report into a 30-second explainer and download it as an MP4
Motion is for content that lands better when shown in motion. The announcement gives three examples: turning a quarterly report into a 30-second explainer for an all-hands meeting, adding motion to the charts in a board deck, and building a product walkthrough for customer onboarding. Onboarding is the process of guiding a new customer through their first use of a product.
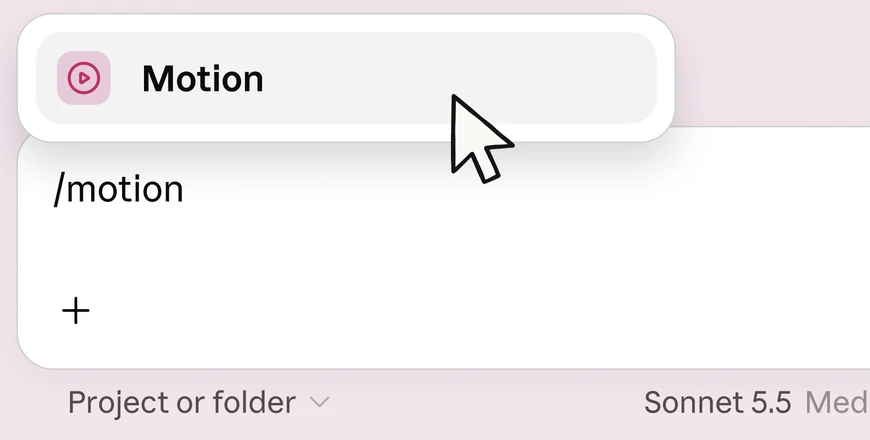
When you ask, Claude builds an animation that plays like a short video. You edit it directly in the editor or ask Claude to change it, then download it as an MP4 file. In the official example screen, typing /motion in the input box brings up the Motion item.
The difference is that it does not use a video generation model. Claude writes code that animates text, charts, shapes, and images. That means you can fix a single word, a single number, even the timing of when something appears, and no generated live-action footage or AI-made people show up. In other words, it is a feature built for explaining your own work.
If you want to refine it further, you can continue in Adobe, Descript, HeyGen, Higgsfield, invideo, Luma AI, and Runway. Canva and Captions are coming soon.
Docs, Slides, and Design have left beta, and the standalone Design site closes on December 14
In the same announcement, Docs, Slides, and Design dropped their beta label. They are available on every Claude plan, including Free. According to Anthropic, more than 45 million documents, decks, and designs have been created in Claude so far. A deck is a bundle of presentation slides.
Five things changed alongside this. Teammates and Claude can edit the same document, deck, design, or dashboard together. If an admin allows it, you can share slides, designs, dashboards, and animations with people outside your organization, or with anyone who has the link. Downloading to PowerPoint or PDF keeps the look you built in the editor, and a deck can be sent straight to Google Slides for editing. You can also edit documents, decks, and designs in the Claude mobile app. And admins can choose the artifact templates their organization uses.
For Enterprise organizations, Docs, Slides, and Design turn on by default from October 15. An admin can also turn them on before then.
The standalone Claude Design site that ran separately at claude.ai/design is being folded into Claude. Since September 16, Design has worked inside every Claude conversation, and the standalone site stays open only until December 14. For design systems, clicking "Migrate team design systems" on Claude's artifacts page moves the whole organization at once. A design system is a reference set that bundles a brand's font, color, and logo rules. Claude conversations and project comments on the standalone site cannot be viewed once the site closes, and the public links to standalone-site projects are cut off at that point too.
What to try today — check your plan, admin settings, and one first request
1. Check your plan. Dashboards needs a paid plan, and Motion needs Team or Enterprise. If you are on Free, what you can use right away from this announcement is Docs, Slides, and Design.
2. If you are on a company Enterprise account, ask your admin to turn on Dashboards and Motion under Organization settings > Artifacts. Dashboards also needs a connection to your company's data platform or a CRM connector.
3. Start with a dashboard you have been waiting for, or a report that one slide was never enough for. Below are request examples taken from Anthropic's announcement.
4. When you get the result, click one key number before sharing and check the query and the refresh time. For a Motion video, compare the numbers and wording against the original report before downloading the MP4.
5. If your team used the standalone claude.ai/design site, migrate your design system before December 14 and save separately any conversations and comments you need to keep.
Build a dashboard of this quarter's revenue by region.
Animate how our pricing plans compare for the sales kickoff.
Turn these notes into a deck for Monday.