There are actually two kinds of swing
There is more than one way to measure how far a market moved in a day. The familiar one is daily change: today's close divided by yesterday's close. From 6,257 to 6,358 is 1.62%. It tells you where the day ended.
The other is intraday range: the day's high minus its low, divided by the prior close. It tells you how much the day shook. When this article says price swing, it means both together.
One real day shows why you need both. On 29 July 2026 the KOSPI closed down 5.98%, but the gap between its high and low that day was 16.03%. By the close it was a bad day; inside the day it was a different market entirely.
Measuring both requires open, high, low and close, not just the close. That is where the data source starts to matter.
Why free chart sites are not enough
Plenty of sites give quotes for free, and wrong values are rare. The failure shows up somewhere else: whole bars go missing.
Pull the 4 August 2026 KOSPI daily bar from Yahoo Finance and open, high, low and close are all 6,358.95, as if the index never moved. The exchange's own record is open 6,351.38, high 6,389.40, low 6,080.25, close 6,358.95. The range that day was 4.94%.
The dangerous part is that the error is quiet. A wrong value looks wrong; a collapsed bar enters your calculation as 0% and quietly drags the average down. One such day is enough to skew a range average, and several of them make a whole window look calmer than it was.
The failure mode of free sources is not a wrong number but a missing or collapsed one. So for Korean daily index and stock data, go to the exchange.
Applying for the KRX Open API — the four steps as labelled
The Korea Exchange runs Data Marketplace OPEN API at openapi.krx.co.kr. The landing page shows four cards, STEP 01 through STEP 04, and those four are the actual process.
Services are split into seven groups: index, stocks, securities products, bonds, derivatives, general commodities and ESG. The index service that holds daily KOSPI data offers five APIs and answers in both json and xml.
| Step | Label on the site | What you do |
|---|---|---|
| STEP 01 | Login / key request | Sign up for Data Marketplace and log in (companies register business details, individuals use identity verification or social login), then request an authentication key and wait for admin approval. |
| STEP 02 | Browse the API service list | Find the API you want in the service list and its spec sheet. Daily KOSPI index data is kospi_dd_trd under the index category. A sample console lets you test calls first. |
| STEP 03 | Request API usage | File a usage request for each API you intend to call and wait for a second admin approval. This gate is separate from key approval. |
| STEP 04 | Build and go live | Once approved, you can call that API. |
The first call is one line of curl
Once approved, calling is plain. Append the service name to the base URL, put the key in a header named AUTH_KEY, and pass one date as basDd. There is no token exchange and no request signing.
The payload sits in an OutBlock_1 array. The index service returns several indices for that date at once, so filter for the row where IDX_NM is the KOSPI. Price fields arrive as strings with thousands separators, so strip the commas before converting.
curl -H "AUTH_KEY: $KRX_API_KEY" \
"https://data-dbg.krx.co.kr/svc/apis/idx/kospi_dd_trd?basDd=20260804"{
"OutBlock_1": [
{
"BAS_DD": "20260804",
"IDX_NM": "코스피",
"OPNPRC_IDX": "6,351.38",
"HGPRC_IDX": "6,389.40",
"LWPRC_IDX": "6,080.25",
"CLSPRC_IDX": "6,358.95"
}
]
}Be your own quant — 30 lines of Python
Quant work sounds grand, but it starts with pulling prices and computing your own statistics. Implementing a definition by hand, instead of reading someone else's indicator, is what tells you exactly what a number counts.
Below is a complete script using only the standard library. Nothing to install; put your key in the KRX_API_KEY environment variable and it runs. It walks a date range one day at a time, picks out the KOSPI row, and reports mean, median and the count of extreme days.
Two lines carry the weight: the one that never calls on weekends, and the one that skips rows with an empty price. The second line is the trading-day test. The exchange returns rows on holidays too, with prices left blank, so judging by whether rows came back gets it wrong.
Running it over 24 July to 4 August gives this.
Widen the window by changing the dates. Note that KRX returns one day per request, so 100 trading days means 100 calls. If you will hit the same dates repeatedly, cache the responses to disk. Settled history never changes, so that cache can be permanent. The one exception is today's date: during the session it returns nothing, and freezing that empty answer would mark the day a permanent holiday.
import os, json, statistics as st, urllib.request, datetime

KEY = os.environ["KRX_API_KEY"]
BASE = "https://data-dbg.krx.co.kr/svc/apis/idx/kospi_dd_trd"

def day(basDd):
    req = urllib.request.Request(f"{BASE}?basDd={basDd}", headers={"AUTH_KEY": KEY})
    rows = json.loads(urllib.request.urlopen(req, timeout=30).read())["OutBlock_1"]
    for r in rows:
        if r["IDX_NM"].strip() == "코스피" and r["CLSPRC_IDX"].strip():
            f = lambda k: float(r[k].replace(",", ""))
            return f("HGPRC_IDX"), f("LWPRC_IDX"), f("CLSPRC_IDX")
    return None                       # 휴장일 — 행은 오되 가격 필드가 비어 있다

d, end, series = datetime.date(2026, 7, 24), datetime.date(2026, 8, 4), []
while d <= end:
    if d.weekday() < 5:               # 주말은 애초에 호출하지 않는다
        v = day(d.strftime("%Y%m%d"))
        if v:
            series.append(v)
    d += datetime.timedelta(days=1)

chg = [abs(series[i][2] / series[i-1][2] - 1) * 100 for i in range(1, len(series))]
rng = [(series[i][0] - series[i][1]) / series[i-1][2] * 100 for i in range(1, len(series))]
print(f"거래일 {len(chg)}일")
print(f"등락률 평균 {st.mean(chg):.2f}% · 중앙 {st.median(chg):.2f}%")
print(f"고저폭 평균 {st.mean(rng):.2f}% · 중앙 {st.median(rng):.2f}%")
print(f"±2% 넘은 날 {sum(1 for c in chg if c >= 2)}일")거래일 7일
등락률 평균 6.24% · 중앙 5.12%
고저폭 평균 8.42% · 중앙 6.23%
±2% 넘은 날 4일Measured — before and after the single-stock leveraged ETF listing
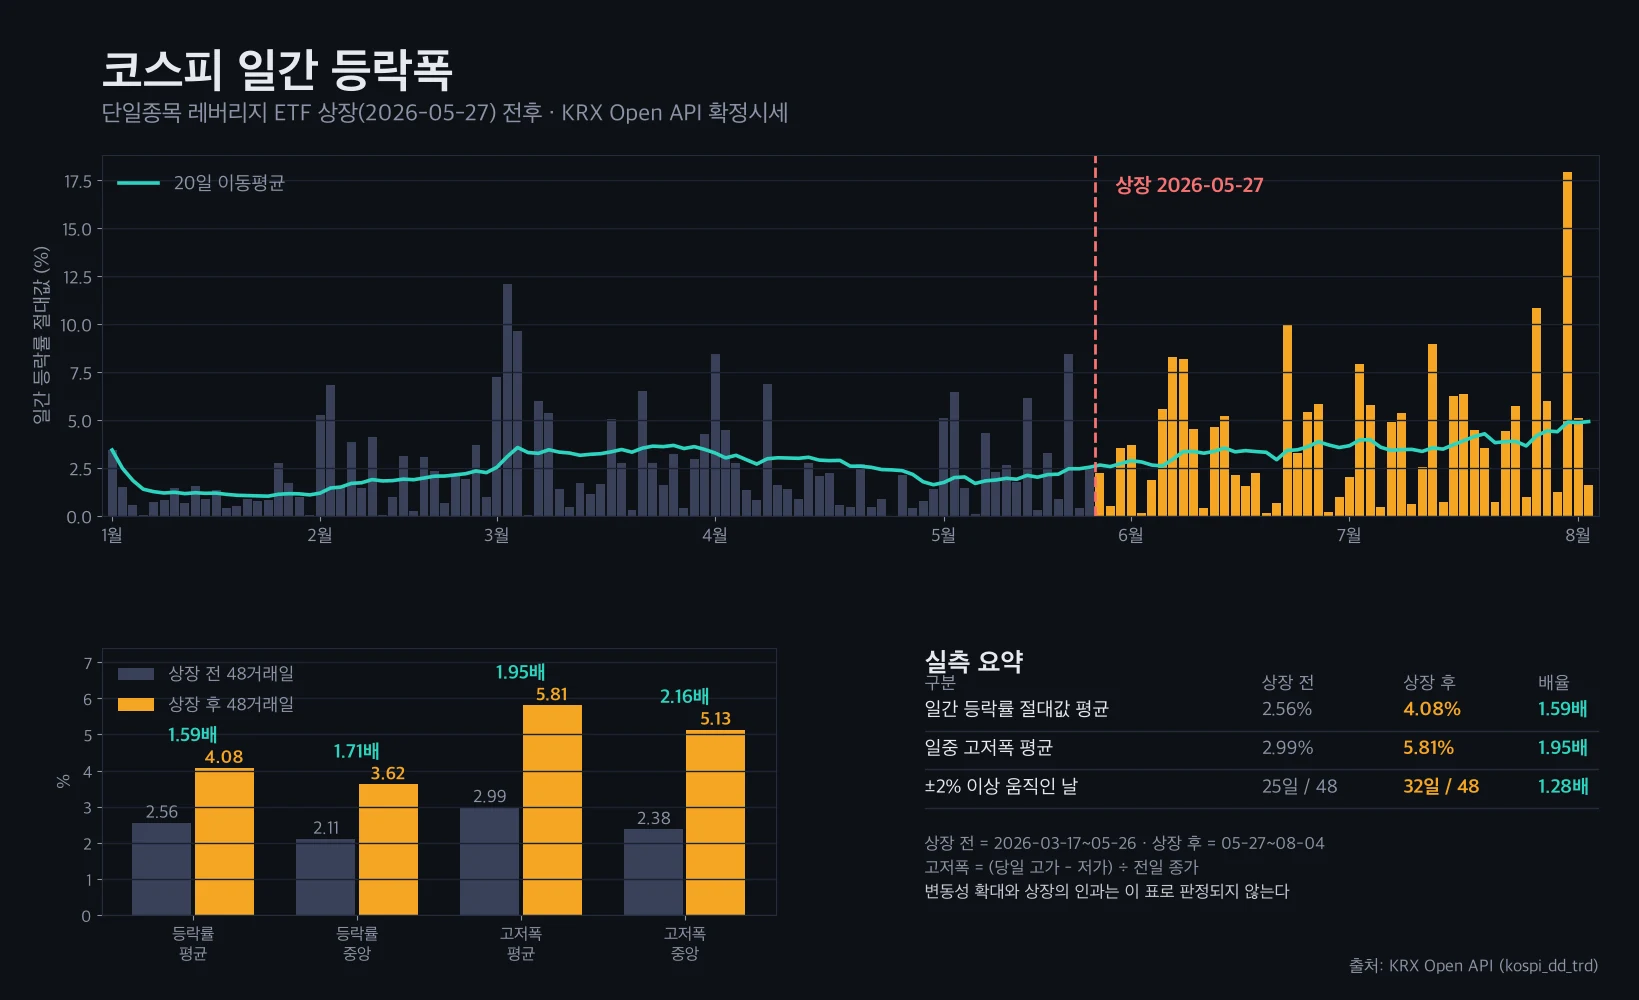
With the same method over a wider window, here is one real question. On 27 May 2026, leveraged and double-inverse ETFs on Samsung Electronics and SK hynix listed together. Did KOSPI daily swings change around that date?
The table compares the 48 trading days before (17 March to 26 May) with the 48 after (27 May to 4 August). Median sits next to mean deliberately, to rule out a single outlier such as the 17.91% move on 31 July carrying the average. The median rose too, so the conclusion survives deleting that day.
| Metric | 48 days before | 48 days after | Ratio |
|---|---|---|---|
| Mean absolute daily change | 2.56% | 4.08% | 1.59x |
| Median absolute daily change | 2.11% | 3.62% | 1.71x |
| Mean intraday range | 2.99% | 5.81% | 1.94x |
| Median intraday range | 2.38% | 5.13% | 2.16x |
| Days moving beyond 2% | 25 of 48 | 32 of 48 | 1.28x |
Four traps you will hit on the first day
First, approval has two gates. Call right after the key approval mail and you get a 401. The message tells you which gate failed: Unauthorized Key means the key itself is invalid, Unauthorized API Call means the key is live but you never filed a usage request for that service. Send a junk string as the key against the same URL and watch the message change; that settles it immediately.
Second, the access axis is reversed. Yahoo takes a symbol and a period and returns a series. KRX takes one date and returns every instrument for that date. A 150-day series for one symbol costs 150 calls. In exchange, each fetched date covers every instrument, so caching by date means adding symbols costs nothing.
Third, holidays still return rows. Ask for a Saturday and 1,155 rows come back with every price field blank. Counting rows to detect trading days is wrong; check whether a price is present. Turned around, that check is the most accurate definition of a trading calendar you can get.
Fourth, closes are not retroactively adjusted. KRX gives the price actually traded that day. Yahoo's close is split-adjusted backwards, the exact opposite. Mixing both sources while applying one split adjustment across the board double-adjusts and corrupts historical quantities. Split the adjustment logic by source.
Finally, know the boundary. This API serves settled T+1 data only, with no live price, order book or ticks. Request today's date and you get zero rows even while the market is open. Use a broker API for real time and a different source for US equities and FX.
How far the numbers let you speak
Measuring it yourself creates one temptation. Swings grew 1.6 to 1.9 times after the listing, so it is tempting to blame the ETFs. The same data does not support that.
Break it down by month and volatility was already climbing before the listing: 1.15% in January, 2.49% in February, 3.64% in March, 2.06% in April, 2.91% in May, 3.57% in June, 4.89% in July. The listing date is not the inflection point. The post-listing window also swallows a July in which the index fell 22%, and the most extreme days cluster two months after the listing.
The Korea Capital Market Institute did not claim causation either. Over the same period SK hynix volatility went from 90% to 101% while Micron went from 85% to 126% and the Philadelphia Semiconductor Index from 46% to 75% — larger moves abroad — and it attributes the change to several overlapping factors including rebalancing flows and macro uncertainty.
So this is where the article stops. KOSPI daily swings widened around the listing. The measured variables are daily change and intraday range, and that they grew is what the data guarantees. Why they grew is not settled by this table.
That is the value of measuring it yourself. Read someone's conclusion and you cannot see how far its evidence reaches. Measure it and you know exactly what your number counted, which is what lets you stop at the edge of it.